How to visualize results
Kubesonde produces a connectivity graph from the recorded probes. You can explore it two ways.
Option A — the bundled in-cluster UI
The installer deploys the Kubesonde frontend alongside the controller. The UI reads probe data from the controller at localhost:2709, so port-forward both:
kubectl --namespace kubesonde-system \
  port-forward service/kubesonde-frontend 8088:8088 &
kubectl --namespace kubesonde-system \
  port-forward deployment.apps/kubesonde-controller-manager 2709:2709 &
Then open http://localhost:8088.
WARNING
The UI expects the controller to be reachable at localhost:2709. If you forward the controller to a different local port, the UI will not find the data.
Option B — the hosted website
If you exported a probes.json, you can upload it to the hosted site without running the UI in your cluster:
- Go to https://kubesonde.jackops.dev.
- Upload your
probes.json. - Explore the connectivity graph.
This is handy for sharing a snapshot or reviewing results offline.
What the graph shows
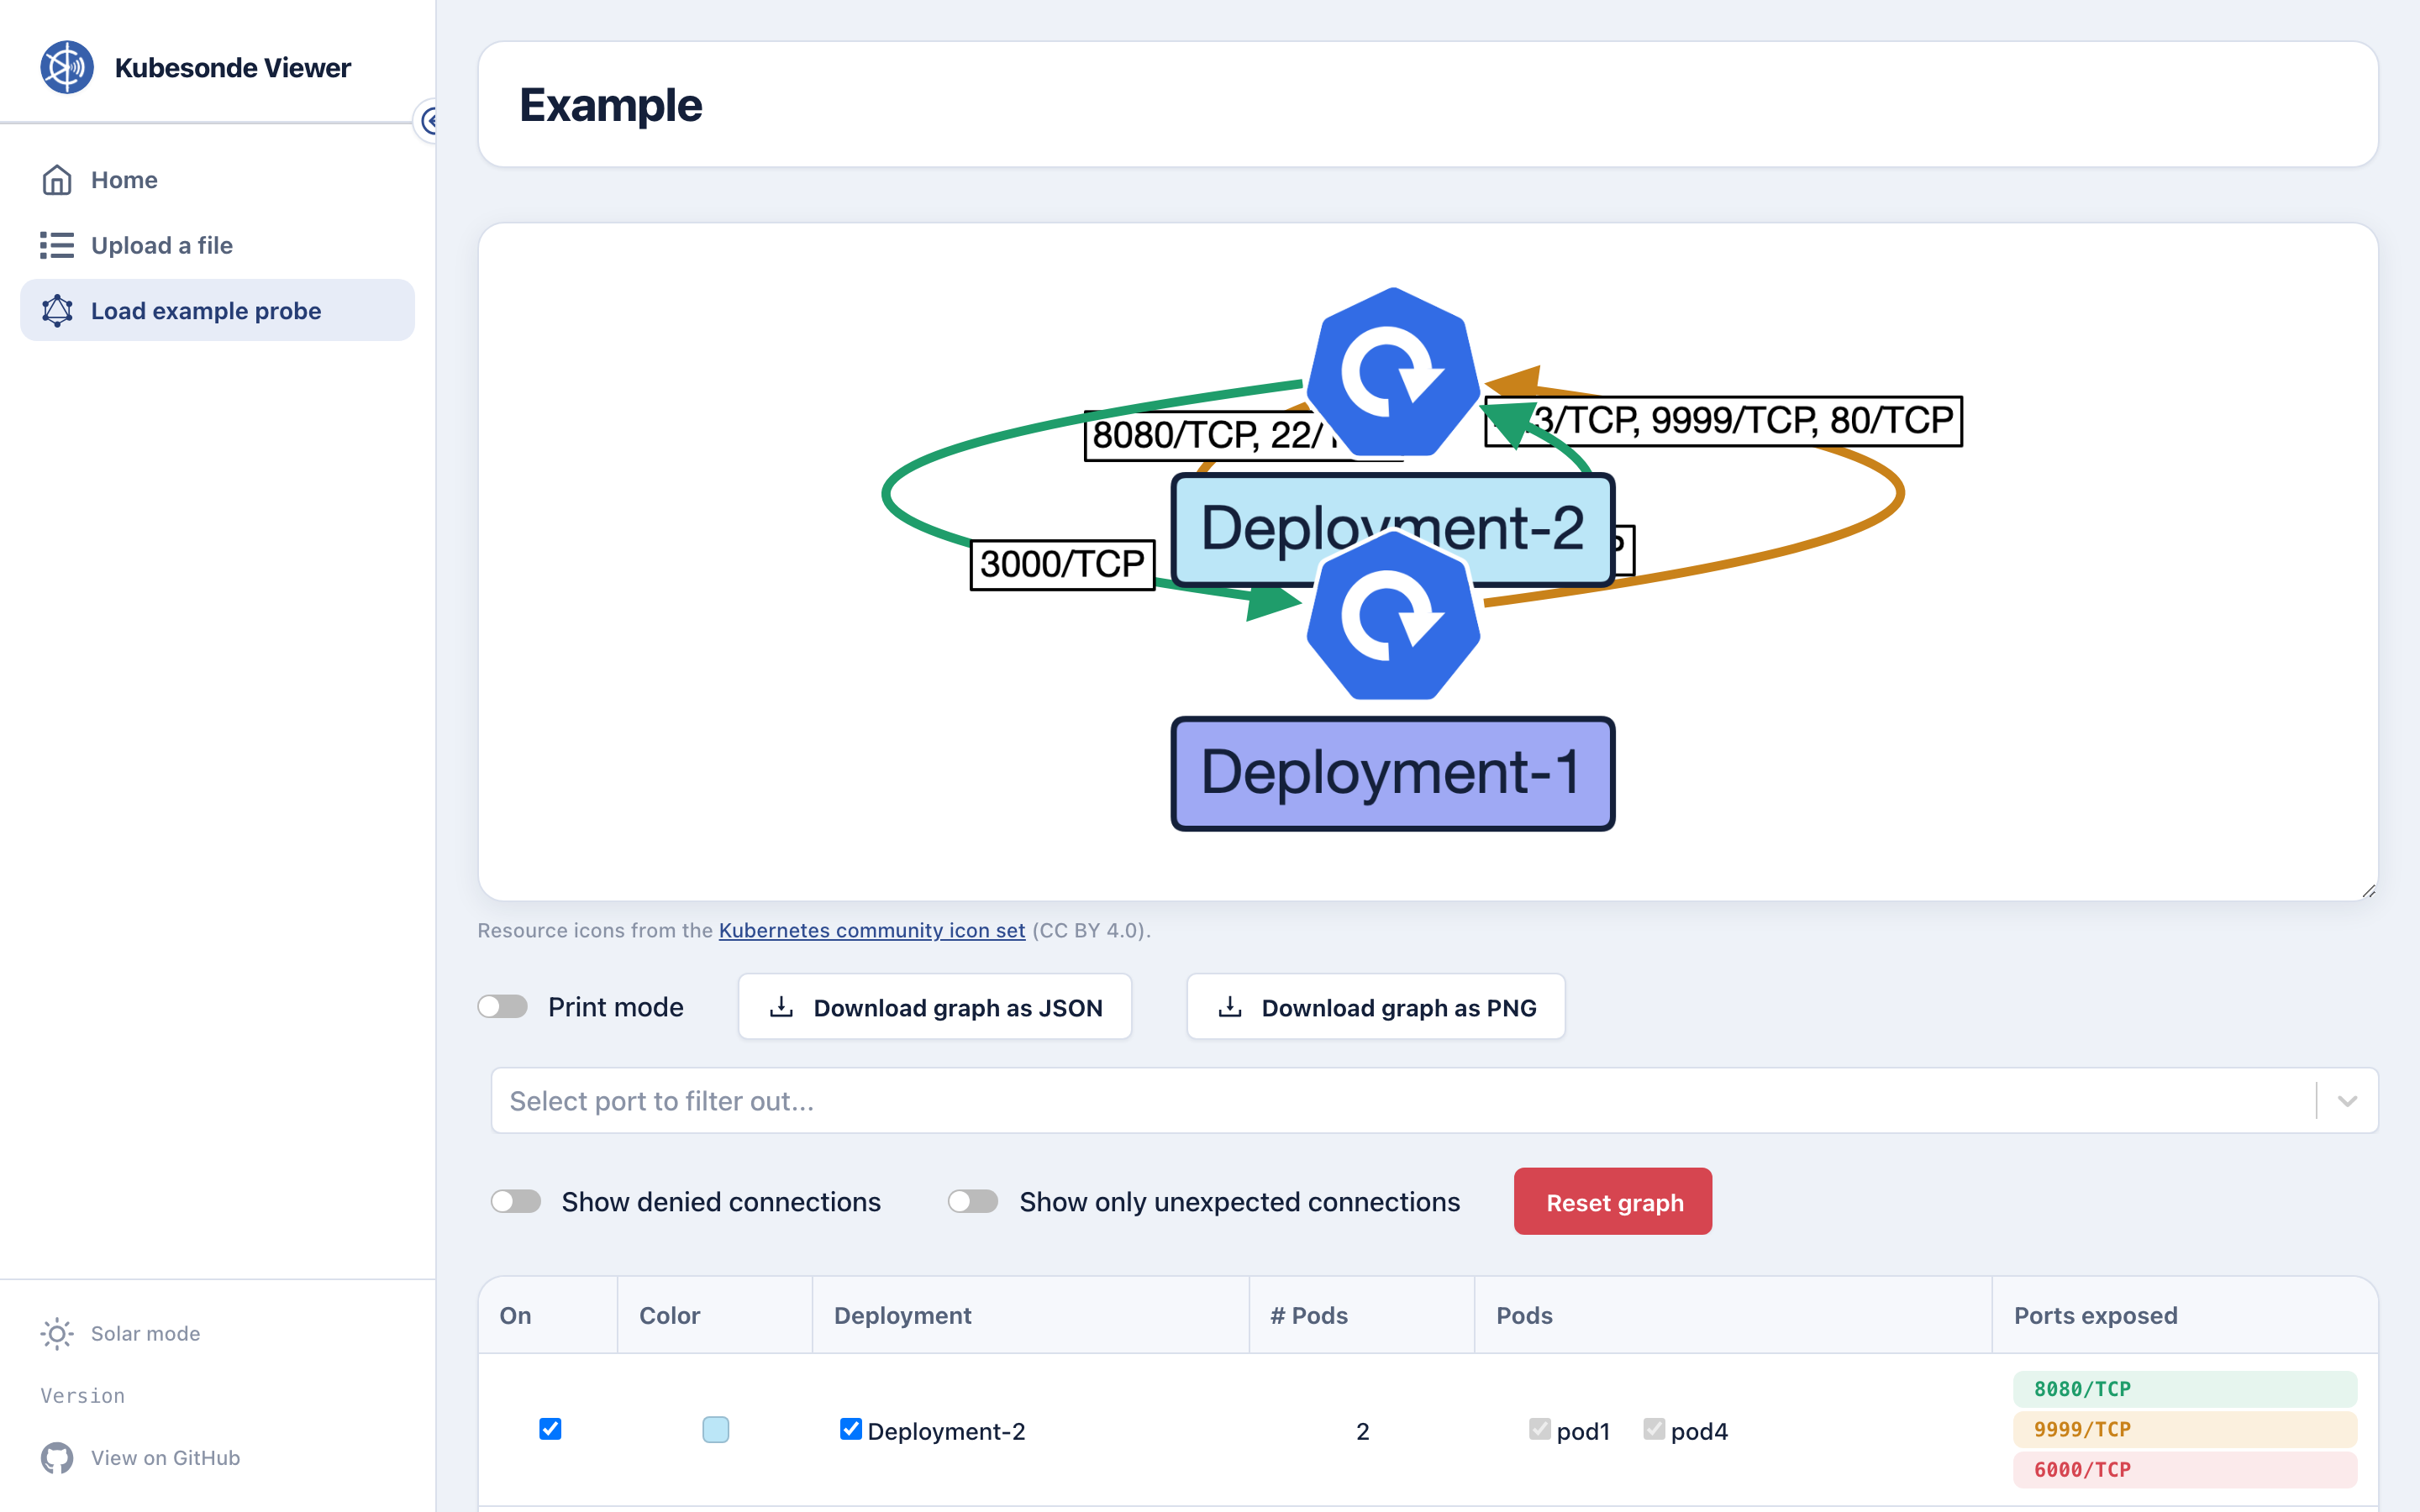
- Nodes are deployments/pods (and external endpoints) that appeared as probe sources or destinations.
- Edges are observed connection attempts, labeled by port/protocol and outcome.
- Toggles let you show denied connections, show only unexpected connections, and filter out specific ports.
- The table below the graph lists each deployment, its pods, and the ports it exposes.
- If you used expected outcomes, mismatches between expected and observed stand out — those are the misconfigurations worth investigating.
You can export the current view with Download graph as PNG or Download graph as JSON.
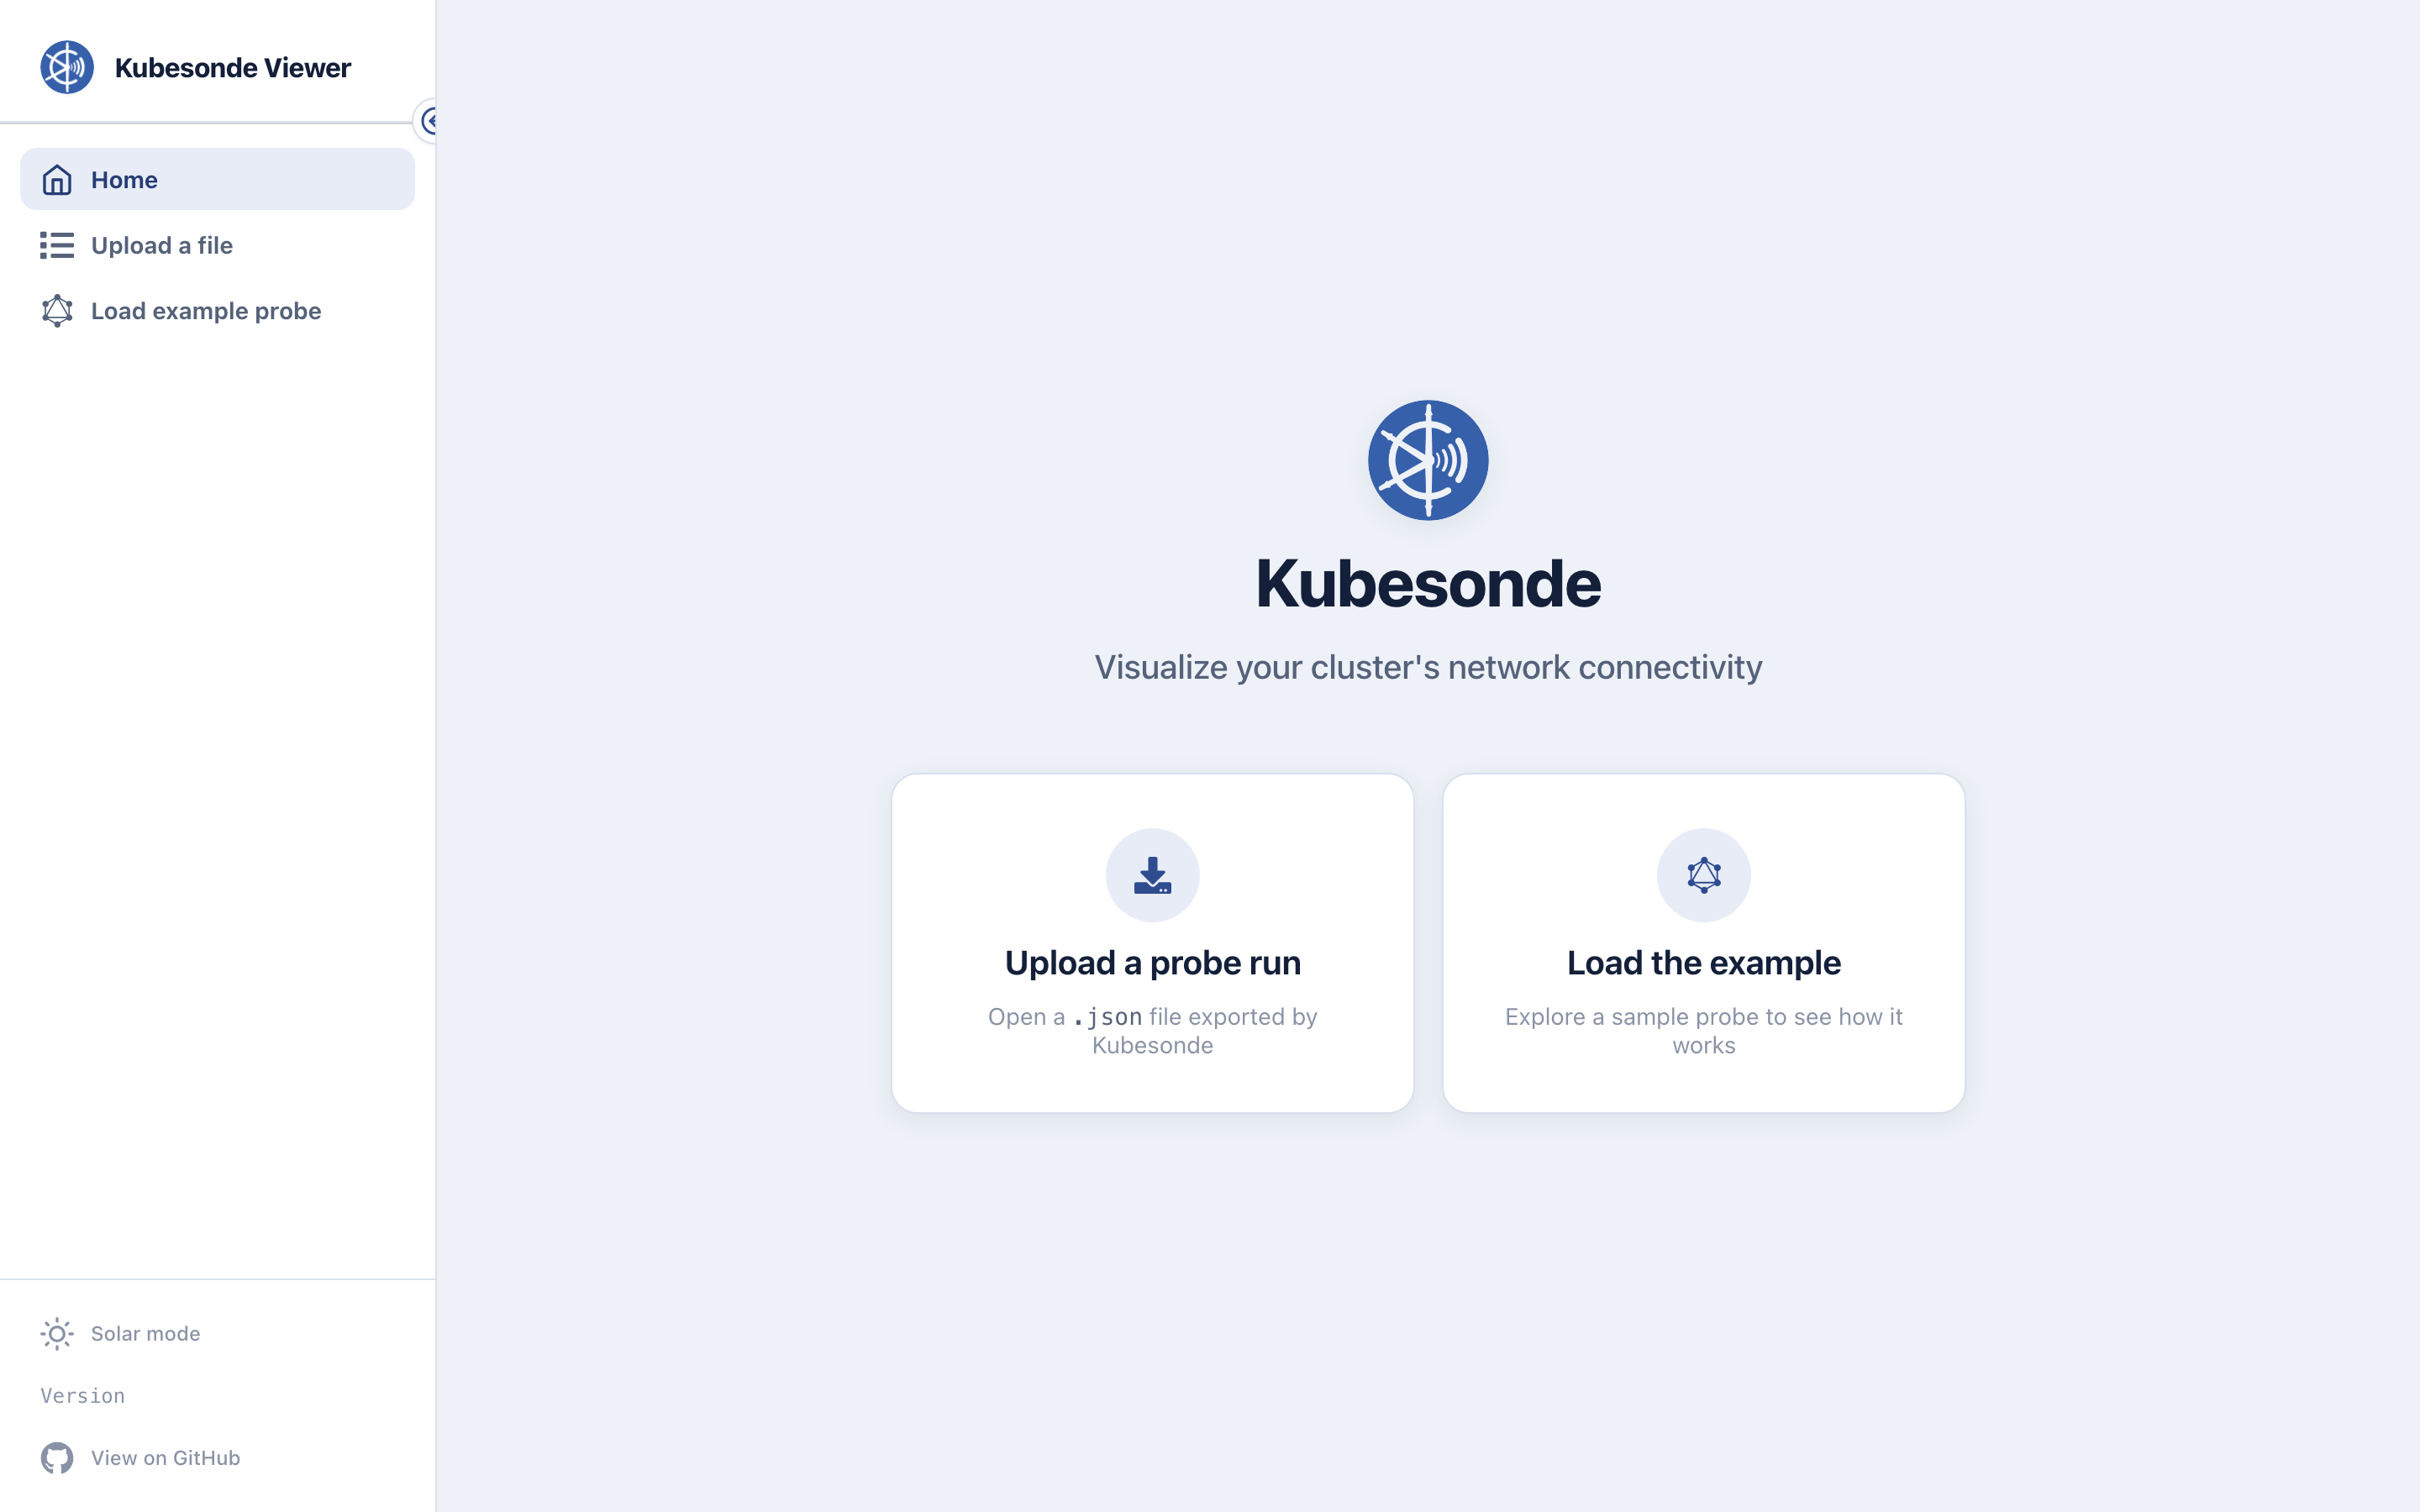
Try it without a cluster
The viewer has a built-in Load example probe option, so you can explore a sample connectivity graph before running your own scan. Open the hosted site and click Load the example.