Architecture
Kubesonde has two parts: a manager (the controller) that runs in the kubesonde-system namespace, and per-pod probe and monitor containers that the manager injects into the pods it targets. A separate frontend reads results from the manager and renders the connectivity graph.
The manager
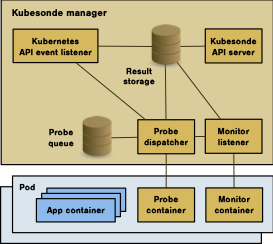
The manager is the controller deployed by the installer (kubesonde-controller-manager). It contains several cooperating pieces:
- Kubernetes API event listener — watches the cluster for the pods it needs to probe (and for
Kubesonderesources). - Kubesonde API server — the HTTP API you port-forward to fetch results (
/probes,/probes/status) on port2709. - Probe queue — the set of pending connection probes derived from your
Kubesondespec. - Probe dispatcher — pulls probes from the queue and runs them through a bounded worker pool, driving the probe containers.
- Monitor listener — receives observations reported by the monitor containers.
- Result storage — where recorded probe outcomes are kept and served from.
Inside a probed pod
For the pods in the target namespace, Kubesonde injects two ephemeral containers alongside your application container (the diagram labels the probe/debugger one as "Probe container"):
debugger— originates the connection attempts. Defaults to the imageinstrumentisto/nmap:latest; override it withspec.debuggerImage.monitor— observes connection activity and reports back to the manager's monitor listener. Defaults toghcr.io/kubesonde/gonetstat:latest; override it withspec.monitorImage.
Your app container is not modified. Because these are ephemeral containers, they are added to the running pods rather than requiring you to change your workloads.
The frontend
The frontend UI is deployed by the installer as kubesonde-frontend. It reads probe data from the manager's API server at localhost:2709 and renders the connectivity graph. The same UI is hosted at kubesonde.jackops.dev for exploring an exported probes.json.
Custom resource
Everything is driven by a single Kubesonde custom resource in the API group security.kubesonde.io/v1. Creating one tells the manager what to probe; its status reports progress and completeness.
Repository layout
| Path | Contents |
|---|---|
crd/ | The manager/controller and the Kubesonde CRD |
frontend/ | The UI for analyzing probe outputs |
examples/ | Sample Kubesonde output (*.json) |
docs/ | Documentation and design notes |